Marketing Research Methods, Process & Analysis
What is Marketing Research?
Marketing Research is the formal process of generating information to help marketing managers make better decisions.
Unlike a Marketing Information System (MIS), which manages the flow of data, Marketing Research is conducted to address a specific problem or opportunity. It is used to identify consumer needs, define market segments, measure the effectiveness of promotions, and develop new products.
According to the American Marketing Association (AMA):
“Marketing Research is the function which links the consumer, customer, and public to the marketer through information.”
The 3 Rs of Marketing Research
David G. Bakken suggests that research helps in three key areas:
Recruiting new customers.
Retaining current customers.
Regaining lost customers.
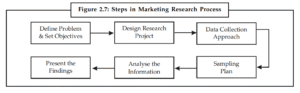
🔄 The 6-Step Marketing Research Process
Conducting research is a systematic journey. While every project is different, most follow this 6-step framework.
Step 1: Define the Problem & Set Objectives
This is the most critical step. A problem well-defined is half solved.
Problem Definition: Uncovering the nature and boundaries of the situation (e.g., “Why has our market share in men’s jeans slipped by 10%?”).
Research Objectives: Defining exactly what information is needed to solve the problem (e.g., “Who are our customers?”, “How are we perceived compared to competitors?”).
Step 2: Design the Research Project
This involves specifying the methods for gathering and analyzing data. To ensure accuracy, the research must be Valid (measures what it’s supposed to measure) and Reliable (gives similar results if repeated).
There are three main categories of research design:
Exploratory Research: Used when the problem is vague. It aims to discover the general nature of the problem. (Sources: Secondary data, expert interviews).
Descriptive Research: Used when the problem is clearly defined. It describes market characteristics or functions (e.g., “How many people visit McDonald’s weekly?”).
Causal (Experimental) Research: Used to prove a cause-and-effect relationship (e.g., “Will changing the package color increase sales?”). It involves experiments in a lab or the field.
Step 3: Data Collection Approach
Researchers must decide where to get the data.
Secondary Data: Information that already exists (e.g., company records, published reports, internet). It is cheaper and faster but may be outdated.
Primary Data: New information collected specifically for the current project.
Methods for Collecting Primary Data:
Observation: Watching how people behave (e.g., in a store).
Survey: Asking people questions (most common method).
Experiment: Testing variables to see the effect.
Step 4: Sampling Plan
You cannot survey everyone. You must select a Sample (a limited number of units) to represent the whole Population (Universe).
Key Decisions:
Sampling Unit: Who is to be surveyed?
Sample Size: How many people? (Larger samples are more reliable but expensive).
Sampling Procedure: How do we choose them?
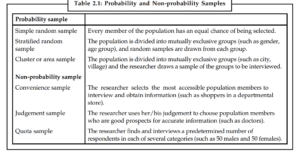
Types of Sampling:
Probability Sampling (Random): Every member has a known and equal chance of being selected. (e.g., Simple Random Sample, Stratified Sample). This is the most accurate.
Non-Probability Sampling: Based on the researcher’s judgment or convenience. (e.g., Convenience Sample, Quota Sample). It is easier and cheaper but less reliable.
Step 5: Analyze the Information
Raw data is useless on its own. The researcher must tabulate and analyze it to find meaningful insights.
Tools: Frequency counts, percentages, averages (mean/median/mode), standard deviation, and advanced statistical tools (regression analysis).
Goal: To interpret the data and accept or reject the hypothesis.
Step 6: Present the Findings
The final step is to present the results to the decision-makers in a formal report.
Executive Summary: A brief overview for senior managers who may not read the full report.
Clear Language: Avoid complex statistical jargon. Explain the findings simply so managers can use them to make decisions.
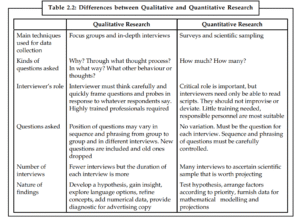
Qualitative vs. Quantitative Research
| Feature | Qualitative Research | Quantitative Research |
| Main Techniques | Focus groups, In-depth interviews | Surveys, Scientific sampling |
| Questions Asked | “Why?”, “In what way?” (Open-ended) | “How much?”, “How many?” (Closed-ended) |
| Sample Size | Fewer interviews, longer duration | Many interviews, shorter duration |
| Goal | To gain insight, develop a hypothesis | To test a hypothesis, get numerical data |
| Nature of Findings | Explore language, refine concepts | Numerical data, projections |
Summary: Why is Marketing Research Important?
It reduces uncertainty in decision-making.
It helps identify new market opportunities.
It allows companies to monitor their performance and customer satisfaction.
It provides the data needed for financial planning and economic forecasting.
We’re constantly updating this page with the latest notes for every Student. Bookmark this page so you can easily find lu notes again, all in one place!
Found a mistake or have a suggestion? We work hard to ensure all notes are 100% accurate. If you spot an error, find a missing subject, or have a request, please [click here to let us know]!
By Lunotes – crafted with love. ❤️