Mastering Financial Statement Analysis for Better Insights
What is Analysis & Interpretation of Financial Statements?
Financial statements (like the P&L Account and Balance Sheet) provide raw data about a company’s performance and position. By themselves, these numbers don’t tell the whole story. To get actionable insights, you need to analyze and interpret them.
Analysis of Financial Statements: This is the process of critically examining the financial data to find a company’s strengths and weaknesses. It involves classifying, rearranging, and comparing data to understand the relationships between different financial factors.
Interpretation of Financial Statements: This is the next step. Interpretation is the art of drawing conclusions from the analyzed data to judge the company’s profitability and financial soundness.
As the text says, the two are closely linked: Analysis is useless without interpretation, and interpretation is impossible without analysis.
The 9-Step Procedure for Analysis
Determine the objective and extent of the analysis.
Collect and study all required financial data. Rearrange it if necessary.
Simplify the data by approximating figures (e.g., to the nearest thousand).
Use analysis techniques (like ratios) to create relationships between items.
Collect any additional, non-financial information that provides context.
Rearrange the data into logical tables for comparison.
Use the right tools to interpret the data and draw conclusions.
Interpret the trends you find by considering the economic facts of the business.
Present your conclusions in a clear, brief report for management.
Types of Financial Analysis
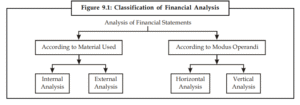
Financial analysis can be classified in two main ways:
1. Analysis According to Material Used
Internal Analysis: This is done by people inside the company, such as management or employees. They have access to all the internal books of account and related information, allowing for a very detailed analysis.
External Analysis: This is done by people outside the company, such as investors, creditors, or the general public. Their analysis is limited to the published financial statements (like the annual report).
2. Analysis According to Modus Operandi (Method)
This is the most common way to classify analysis techniques.
Horizontal (or Dynamic) Analysis: This method involves comparing the financial data of a company over several years. The data is placed side-by-side (horizontally) to see the trend. This helps you understand the company’s performance and growth over time.
Vertical (or Static) Analysis: This method involves analyzing the financial statements for a single period (one year). You compare each item on the statement to a common base. For example, you might see what percentage of “Total Assets” is “Cash” (on the Balance Sheet) or what percentage of “Total Sales” is “Gross Profit” (on the P&L).
Techniques of Financial Analysis (The Toolbox)
To analyze and interpret data, you can use several tools. The most common techniques for BBA and MBA students are:
Comparative Statements: (Horizontal Analysis) Comparing two or more years of statements side-by-side.
Common Size Statements: (Vertical Analysis) Expressing all items as a percentage of a common base (like Total Assets or Net Sales).
Trend Analysis: (Horizontal Analysis) Comparing items over several years to a single “base year” to see the long-term tendency.
Fund Flow Analysis: Analyzes the changes in a company’s working capital between two balance sheet dates.
Cash Flow Analysis: (As per AS-3) Shows the “inflow” and “outflow” of actual cash during a period.
Ratio Analysis: The most popular technique. It expresses the relationship between different accounting figures as a ratio (e.g., Current Ratio = Current Assets / Current Liabilities).
Break-even Analysis: A management tool that divides costs into “fixed” and “variable” to find the point where a company makes no profit and no loss.
Deep Dive 1: Comparative Financial Statements
This is a horizontal analysis tool. You place two years of data side-by-side and add two new columns:
Absolute Change: The increase or decrease in the amount (in ₹).
Relative Change: The absolute change expressed as a percentage (%).
(Absolute Change / Base Year Amount) * 100
Comparative Balance Sheet
Illustration 1: The Balance Sheets of Kavita Ltd. for 2006 and 2007 are as follows. Prepare a Comparative Balance Sheet.
Solution:
Comparative Balance Sheet of Kavita Ltd.
As on 31st Dec. 2006 and 2007
| Particulars | 2006 (₹) | 2007 (₹) | Absolute Change (₹) | Relative Change (%) |
|---|---|---|---|---|
| Assets | ||||
| Fixed Assets | ||||
| Land & Building | 4,000 | 6,000 | +2,000 | +50.0% |
| Plant & Machinery | 2,000 | 3,000 | +1,000 | +50.0% |
| Total Fixed Assets | 6,000 | 9,000 | +3,000 | +50.0% |
| Investment | 1,200 | 1,600 | +400 | +33.33% |
| Current Assets | ||||
| Debtors | 800 | 1,000 | +200 | +25.0% |
| Stock | 1,600 | 1,800 | +200 | +12.5% |
| Cash | 400 | 600 | +200 | +50.0% |
| Total Current Assets | 2,800 | 3,400 | +600 | +21.43% |
| TOTAL ASSETS | 10,000 | 14,000 | +4,000 | +40.0% |
| Liabilities & Equity | ||||
| Equity & Reserves | ||||
| Equity Share Capital | 8,000 | 10,000 | +2,000 | +25.0% |
| Capital Reserve | 300 | 1,800 | +1,500 | +500.0% |
| Long-Term Liabilities | ||||
| 10% Debentures | 1,200 | 1,600 | +400 | +33.33% |
| Current Liabilities | ||||
| Creditors | 500 | 600 | +100 | +20.0% |
| TOTAL LIABILITIES & EQUITY | 10,000 | 14,000 | +4,000 | +40.0% |
Interpretation:
The company has significantly increased its Fixed Assets (+50%) and Investments (+33.33%).
This growth was financed by issuing new shares (+25%) and debentures (+33.33%).
Reserves have grown by 500%, indicating strong profitability.
The financial position appears to be improving and growing.
Comparative Statement of Working Capital
This statement focuses only on the changes in Current Assets and Current Liabilities to see the change in net working capital.
Illustration 3: From the following, prepare a schedule of changes in working capital.
|
Schedule of Changes in Working Capital
| Particulars | 2006 (₹) | 2007 (₹) | Increase in Working Capital (₹) | Decrease in Working Capital (₹) |
|---|---|---|---|---|
| Current Assets (CA) | ||||
| Cash in Hand | 10,000 | 14,000 | 4,000 | |
| Cash at Bank | 14,000 | 18,000 | 4,000 | |
| Book Debts | 24,000 | 22,000 | 2,000 | |
| Inventory | 8,000 | 6,000 | 2,000 | |
| Bills Receivable | 4,000 | 3,000 | 1,000 | |
| Prepaid Expenses | 400 | 600 | 200 | |
| Short-term Investments | 10,000 | 16,000 | 6,000 | |
| Accrued Interest | 2,000 | 1,200 | 800 | |
| (A) Total Current Assets | 72,400 | 80,800 | ||
| Current Liabilities (CL) | ||||
| Accounts Payable | 16,000 | 12,000 | 4,000 | |
| Notes Payable | 6,000 | 4,000 | 2,000 | |
| Bank Overdraft | 8,000 | 6,000 | 2,000 | |
| Outstanding Expenses | 600 | 400 | 200 | |
| Provision for Bad Debts | 1,000 | 1,400 | 400 | |
| (B) Total Current Liabilities | 31,600 | 23,800 | ||
| Working Capital (A – B) | 40,800 | 57,000 | ||
| Net Increase in Working Capital | 16,200 | |||
| Totals | 22,400 | 6,200 | ||
| (Increase – Decrease = 22,400 – 6,200 = 16,200) |
(Note: An increase in CA increases WC. A decrease in CL also increases WC.)
Deep Dive 2: Common Size Statements
This is a vertical analysis tool. All items are expressed as a percentage of a common base, making it easy to see the structure of the statements.
For the Balance Sheet: The base is Total Assets (100%) and Total Liabilities + Equity (100%).
For the Income Statement: The base is Net Sales (100%).
Illustration 4: Convert the following statements for Rajeev Ltd. into Common Size Statements.
| Income Statement (abridged) | 2007 (₹) | 2008 (₹) |
| Net Sales | 700 | 900 |
| Less: Cost of Goods Sold | 380 | 430 |
| Gross Profit | 320 | 470 |
| Less: Selling & Admin. Cost | 100 | 144 |
| Operating Profit | 220 | 326 |
| Less: Interest | 40 | 34 |
| Earning Before Taxes | 180 | 292 |
| Less: Taxes | 63 | 103 |
| Earning After Taxes | 117 | 189 |
| Balance Sheet (abridged) | 2007 (₹) | 2008 (₹) |
| Assets | ||
| Plant | 804 | 780 |
| Cash | 108 | 156 |
| Debtors | 120 | 130 |
| Inventories | 168 | 234 |
| Total Assets | 1,200 | 1,300 |
| Liabilities & Equity | ||
| Equity Share Capital | 480 | 480 |
| General Reserves | 192 | 364 |
| Long-term Loans | 364 | 339 |
| Creditors | 134 | 104 |
| Outstanding Expenses | 12 | – |
| Other Current Liabilities | 18 | 13 |
| Total Liabilities & Equity | 1,200 | 1,300 |
Common Size Income Statement
For the year ended March 31
(Base: Net Sales = 100%)
| Particulars | 2007 (%) | 2008 (%) |
|---|---|---|
| Net Sales | 100.0% | 100.0% |
| Less: Cost of Goods Sold | 54.3% | 47.8% |
| Gross Profit | 45.7% | 52.2% |
| Less: Selling & Admin. Cost | 14.3% | 16.0% |
| Operating Profit | 31.4% | 36.2% |
| Less: Interest | 5.7% | 3.8% |
| Earning Before Taxes (EBT) | 25.7% | 32.4% |
| Less: Taxes | 9.0% | 11.4% |
| Earning After Taxes (EAT) | 16.7% | 21.0% |
(Interpretation: In 2008, the company became more financially stable. It relies less on debt (Loans dropped from 30.3% to 26.1%) and more on Owner’s Equity (which grew from 56% to 64.9% of total financing).)
Deep Dive 3: Trend Analysis
This is a horizontal analysis tool used for comparing data over many years (e.g., 4-5 years) to see the “tendency” or trend.
How it works:
Choose a Base Year (usually the earliest year) and set all its values to 100%.
Calculate the trend percentage for all other years by dividing that year’s value by the base year’s value.
Formula:
(Current Year Amount / Base Year Amount) * 100
Trend Percentage Analysis
(Base Year = 2004 = 100)
| Assets | 2004 (%) | 2005 (%) | 2006 (%) | 2007 (%) |
|---|---|---|---|---|
| Cash | 100 | 150 | 200 | 175 |
| Debtors | 100 | 200 | 150 | 75 |
| Stock | 100 | 150 | 120 | 140 |
| Land & Building | 100 | 125 | 150 | 150 |
| Plant | 100 | 125 | 130 | 150 |
| Total Assets | 100 | 128 | 138 | 145 |
(How to read this: In 2005, Cash was 150% of its 2004 level (it grew 50%). In 2007, Debtors fell to 75% of the 2004 level (a 25% drop from the base). This shows a strong growth in assets overall, but a potential issue with debtor collections in the final year.)
📚 Keep Studying!
We hope these Financial Management and Accounting notes help you build a strong foundation for your BBA. LuNotes is your one-stop solution for all Lucknow University notes. Don’t forget to check out our notes for other subjects in your semester!
[Link to Principles of Management Notes]
[Link to Personality Development Notes]
[Link to Complete Computer application Notes]
Found a mistake? We work hard to ensure all notes are 100% accurate and as per the latest LU syllabus. If you spot an error or have a suggestion, please [click here to report it]. (You would link this text to a contact form or email).
By LuNotes – your trusted for Lucknow University Semester exam notes, crafted with love. ❤️