Marketing Research is the formal process of generating information to help marketing managers make better decisions.
Unlike a Marketing Information System (MIS), which manages the flow of data, Marketing Research is conducted to address a specific problem or opportunity. It is used to identify consumer needs, define market segments, measure the effectiveness of promotions, and develop new products.
According to the American Marketing Association (AMA):
“Marketing Research is the function which links the consumer, customer, and public to the marketer through information.”
The 3 Rs of Marketing Research
David G. Bakken suggests that research helps in three key areas:
Recruiting new customers.
Retaining current customers.
Regaining lost customers.
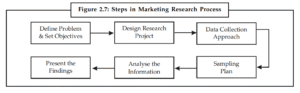
🔄 The 6-Step Marketing Research Process
Conducting research is a systematic journey. While every project is different, most follow this 6-step framework.
Getty Images
Step 1: Define the Problem & Set Objectives
This is the most critical step. A problem well-defined is half solved.
Problem Definition: Uncovering the nature and boundaries of the situation (e.g., “Why has our market share in men’s jeans slipped by 10%?”).
Research Objectives: Defining exactly what information is needed to solve the problem (e.g., “Who are our customers?”, “How are we perceived compared to competitors?”).
Step 2: Design the Research Project
This involves specifying the methods for gathering and analyzing data. To ensure accuracy, the research must be Valid (measures what it’s supposed to measure) and Reliable (gives similar results if repeated).
There are three main categories of research design:
Exploratory Research: Used when the problem is vague. It aims to discover the general nature of the problem. (Sources: Secondary data, expert interviews).
Descriptive Research: Used when the problem is clearly defined. It describes market characteristics or functions (e.g., “How many people visit McDonald’s weekly?”).
Causal (Experimental) Research: Used to prove a cause-and-effect relationship (e.g., “Will changing the package color increase sales?”). It involves experiments in a lab or the field.
Step 3: Data Collection Approach
Researchers must decide where to get the data.
Secondary Data: Information that already exists (e.g., company records, published reports, internet). It is cheaper and faster but may be outdated.
Primary Data: New information collected specifically for the current project.
Methods for Collecting Primary Data:
Observation: Watching how people behave (e.g., in a store).
Survey: Asking people questions (most common method).
Experiment: Testing variables to see the effect.
Step 4: Sampling Plan
You cannot survey everyone. You must select a Sample (a limited number of units) to represent the whole Population (Universe).
Key Decisions:
Sampling Unit: Who is to be surveyed?
Sample Size: How many people? (Larger samples are more reliable but expensive).
Sampling Procedure: How do we choose them?
Types of Sampling:
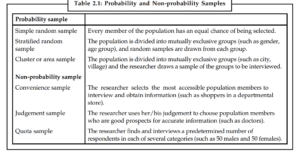
Probability Sampling (Random): Every member has a known and equal chance of being selected. (e.g., Simple Random Sample, Stratified Sample). This is the most accurate.
Non-Probability Sampling: Based on the researcher’s judgment or convenience. (e.g., Convenience Sample, Quota Sample). It is easier and cheaper but less reliable.
Step 5: Analyze the Information
Raw data is useless on its own. The researcher must tabulate and analyze it to find meaningful insights.
Tools: Frequency counts, percentages, averages (mean/median/mode), standard deviation, and advanced statistical tools (regression analysis).
Goal: To interpret the data and accept or reject the hypothesis.
Step 6: Present the Findings
The final step is to present the results to the decision-makers in a formal report.
Executive Summary: A brief overview for senior managers who may not read the full report.
Clear Language: Avoid complex statistical jargon. Explain the findings simply so managers can use them to make decisions.
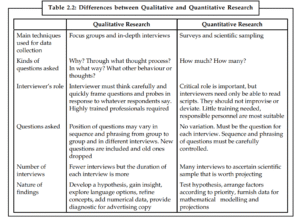
Qualitative vs. Quantitative Research
Feature
Qualitative Research
Quantitative Research
Main Techniques
Focus groups, In-depth interviews
Surveys, Scientific sampling
Questions Asked
“Why?”, “In what way?” (Open-ended)
“How much?”, “How many?” (Closed-ended)
Sample Size
Fewer interviews, longer duration
Many interviews, shorter duration
Goal
To gain insight, develop a hypothesis
To test a hypothesis, get numerical data
Nature of Findings
Explore language, refine concepts
Numerical data, projections
Summary: Why is Marketing Research Important?
It reduces uncertainty in decision-making.
It helps identify new market opportunities.
It allows companies to monitor their performance and customer satisfaction.
It provides the data needed for financial planning and economic forecasting.
We’re constantly updating this page with the latest notes for every Student. Bookmark this page so you can easily find lu notes again, all in one place!
Found a mistake or have a suggestion? We work hard to ensure all notes are 100% accurate. If you spot an error, find a missing subject, or have a request, please [click here to let us know]!
In the modern market, competition is rarely about the product itself; it is about the “augmented” product. As Prof. Theodore Levitt noted nearly 45 years ago, the new competition is about what companies add to their factory output in the form of packaging, services, advertising, and things people value.
A Brand is defined as a name, term, sign, symbol, or design (or a combination of them) intended to identify the goods and services of one seller and differentiate them from the competition.
However, a brand is much more than a tag. It is a contract with the consumer regarding performance. It builds a bond of faith and trust, eliminating search costs and risks for the buyer.
1. Brand Identity vs. Brand Image
It is crucial for students to distinguish between how a brand is seen internally versus externally.
A. Brand Identity (The Insider’s Concept)
Brand identity refers to the brand strategist’s vision. It is a unique set of brand associations that the company aspires to create or maintain. It represents what the brand stands for and implies a promise to customers.
Jean-Noel Kapferer identified six dimensions of Brand Identity (The Brand Identity Prism):
Physique: The tangible, physical aspects (features, logo, packaging). Example: IBM’s physique includes desktops and servers.
Personality: The brand character (using adjectives like “rugged,” “youthful,” or “sophisticated”). Example: Boost is energetic; Bajaj Pulsar is “Definitely Male.”
Culture: The values and principles the brand reflects. Example: Apple symbolizes simplicity and innovation; Mercedes symbolizes German engineering efficiency.
Relationship: The transaction and exchange between the brand and customer. Example: Nike’s “Just Do It” encourages the user to win; Apple conveys friendliness.
Reflection: The image of the target consumer that the brand projects. Example: Pepsi reflects young, carefree, fun-loving people.
Self-Image: How the customer perceives themselves when using the brand. Example: A Nike user sees their inner athlete.
B. Brand Image (The Outsider’s Concept)
Brand Image is the sum total of impressions created by the brand in the consumer’s mind. It encompasses physical characteristics, functional benefits, and symbolic meanings.
Types of Brand Associations:
Hard Associations: Perceptions of tangible attributes like speed, fuel economy, or sturdiness.
Soft Associations: Emotional perceptions. Example: Indian Airlines may be associated with dullness or inefficiency, while Bajaj Pulsar is associated with excitement.
The Three Elements of Brand Image (Alexander L. Biel):
Image of Provider: The reputation of the manufacturer. An inappropriate corporate image can hurt a good product. Example: Apple is seen as creative/cool; DCM is seen as old/dull.
Image of Product: The functional characteristics and technology. Example: Laundry detergents are driven by rationality, while perfumes are driven by emotion.
Image of User: Who uses the product? Example: The image of Raymond Suitings is “The Complete Man.”
2. Brand Equity (The Value of the Brand)
Brand Equity is the value a brand adds to a product. It explains why a product with a brand name can command a higher price and loyalty than an identical unbranded product.
Definitions:
David Aaker: “Brands have equity because they have high awareness, many loyal consumers, a high reputation for perceived quality, and proprietary assets.”
Kevin Lane Keller: “Brand equity is the marketing effects uniquely attributed to the brand. It is when certain outcomes result because of the brand name that would not occur otherwise.”
The 5 Dimensions of Customer-Based Brand Equity: (By Lasser, Mittal, and Sharma)
Performance: Is the product fault-free and durable?
Social Image: Does the brand hold esteem within the customer’s social group?
Value: The ratio between the cost and the perceived delivered value.
Trustworthiness: Does the customer have faith in the brand’s quality and the people behind it?
Identification: Does the customer feel emotionally attached to the brand? (Does it match their self-concept?)
3. Types of Brands
Marketers have several options when deciding the ownership of a brand.
Manufacturer Brands (National Brands):
Initiated by producers.
The initiator controls distribution, pricing, and promotion.
Focus: Building brand loyalty and corporate image.
Private Brands (Store/House Brands):
Initiated by resellers (wholesalers or retailers).
The manufacturer is not identified on the product.
Example: Shoppers’ Stop brands.
Trend: Gaining popularity in India as large retail chains grow (e.g., Reliance Retail).
Licensed Brands:
A company allows approved manufacturers to use its trademark for a royalty fee (2% – 10% of revenue).
Example: P&G licensed the ‘Camay’ soap brand to Godrej in India for a period.
Risk: The licensor loses control over manufacturing, which may hurt the brand reputation.
Generic Brands:
Products that indicate only the product category (e.g., “Aluminium Foil” or “Paracetamol”).
They are usually sold at lower prices than branded versions.
4. Branding Strategies (Detailed)
Companies grow by adding products. They must decide how to name them. Here are the six generic strategies:
1. Product Branding Strategy (One Product, One Brand)
The company assigns a unique name to every product. The brand reflects its own personality and does not take on company associations.
Philosophy: “Singularity.” Create the perception that there is no product quite like this one.
Example:P&G (Tide, Ariel, Pantene, Vicks, Old Spice) and HUL (Lux, Dove, Liril, Lifebuoy). Even though Ariel and Tide are both detergents by P&G, they have separate identities.
Advantage: You can cover different market segments without confusion. If one brand fails, it doesn’t hurt the company’s reputation.
Disadvantage: Extremely expensive to build a new brand from scratch ($5 million – $50 million).
2. Line Branding Strategy
Products share a common concept. The brand starts with one product and extends to complementary products that “surround” the core need.
Example:Lakmé (Core concept: Beauty). The brand extends to lipsticks, winter lotions, and face wash because they all complement the core concept of beauty. Park Avenue (Core concept: The upwardly mobile man).
Advantage: Stronger brand identity; promotion of the main brand helps all items in the line.
3. Range Branding Strategy (Brand Extension)
Different product categories share the same brand name because they fall under the company’s “Area of Expertise.”
Difference from Line Branding: In Line Branding, products complement each other (lipstick + makeup remover). In Range Branding, products might not complement each other, but they share a domain.
Example:Maggi (Noodles, Sauces, Soups, Dosa mixes). The area of expertise is “Fast Food.” Himalaya (Ayurvedic concepts).
Advantage: One brand banner covers many products, lowering promotional costs.
Risk: Overstretching may confuse consumers.
4. Umbrella Branding Strategy (Mega Branding)
The company name is the brand name for all products across diverse, unrelated categories. This is common in Eastern companies (Japan, Korea).
Example:Samsung, Sony, Tata, Amul, Philips, GE.
Advantage: Very economical. Transfers the goodwill of the company to new products instantly.
Disadvantage: Not market-focused. A failure in one category (e.g., a faulty toaster) can tarnish the image of another category (e.g., medical equipment).
5. Double Branding Strategy
Combining the company name AND a product brand name. Both are given equal status.
Why? The product gains trust from the company name (Bajaj) and excitement/differentiation from the product name (Pulsar – “Definitely Male”).
Limitation: Works best when the product is consistent with the company’s expertise.
6. Endorsement Branding Strategy
A variation of double branding where the Product Brand dominates, and the Company Name takes a back seat, acting only as a seal of quality (endorsement).
Example:Kit-Kat (endorsed by Nestlé), Cinthol (endorsed by Godrej).
Advantage: The brand gets freedom to have its own distinct image (fun, youthful) while assuring the customer of the manufacturer’s quality.
5. Packaging and Trade Marks
Packaging
Packaging includes all activities focused on the development of a container and a graphic design for a product. It is often called the “Silent Salesman.”
Functions: It protects the product, identifies the brand, offers convenience to the user, and acts as a promotional tool on the shelf.
Trade Marks
A trademark is a brand, brand name, brand mark, or trade character that has been given legal protection. It protects the seller’s exclusive rights to use that brand name or mark, preventing competitors from copying it.
In the world of marketing, the “Product” is the engine that pulls the rest of the marketing program. It is the most critical element of the marketing mix because if the product fails to deliver value, no amount of clever pricing or promotion can save it.
This comprehensive article covers the entire journey of a product: from its policy and planning to its development and eventual life cycle in the market.
What is a Product? (Concepts & Levels)
A Product is anything that can be offered to a market to satisfy a want or a need. It is not just a tangible object; it includes services, events, persons, places, organizations, and even ideas.
According to Philip Kotler:
“A product is anything, tangible or intangible, which can be offered to a market for attention, acquisition, use, or consumption that might satisfy a need or want.”
The 5 Levels of a Product (Customer Value Hierarchy)
To understand what a customer truly buys, marketers analyze a product on five levels:
Core Benefit: The fundamental service or benefit that the customer is really buying. (e.g., For an Air Conditioner, the core benefit is “Cooling and Comfort”).
Generic Product: The basic version of the product that performs the function. (e.g., The AC machine itself with basic components).
Expected Product: The set of attributes and conditions buyers normally expect when they purchase this product. (e.g., Remote control, warranty, quiet operation, cooling speeds).
Augmented Product: Additional features, benefits, or services that exceed customer expectations and set the product apart from competitors. (e.g., Free installation, 24/7 customer support, smart-home connectivity). Competition mostly happens at this level.
Potential Product: All the possible augmentations and transformations the product might undergo in the future. (e.g., An AC that runs on solar power, purifies air like a tree, and is completely silent).
What is Product Policy Decisions? (Nature & Scope)
Before a single product is made, top management must set the ground rules. This is called Product Policy.
Product Policy refers to the broad guidelines and rules set by top management that determine the nature, volume, and timing of the products a company offers. It acts as a compass for all product-related decisions, ensuring they align with the company’s long-term goals.
Nature of Product Policy:
Strategic Guide: It is a long-term strategic plan, not a short-term tactic.
Top Management Function: Critical decisions (like entering a new market or dropping a product line) are taken by the Board of Directors.
Focus: It balances maximizing customer satisfaction with ensuring profitability and growth.
Objectives of Product Policy:
Survival: To keep the company viable in a competitive market.
Growth: To increase sales volume and market share over the long run.
Flexibility: To remain adaptable to changing customer needs and technology.
Resource Utilization: To optimize the use of production capacity, finance, and marketing networks.
Scope of Product Policy (What it covers):
Product Mix Decisions: Broadening or narrowing the product mix.
Product Line Decisions: Stretching or filling the product line.
Product Differentiation: How to distinguish the product (branding, packaging).
Product Innovation: Policies regarding R&D for new products.
Product Mix (Product Assortment)
Most companies do not sell just a single product. They sell a variety of goods to satisfy different market needs. The total set of all products and items that a particular seller offers for sale is called the Product Mix, also known as Product Assortment.
To understand this concept, let’s look at two real-world examples: Patanjali and Nestlé.
Real-World Examples
1. Patanjali Ayurved: Patanjali does not just sell toothpaste. Its “Product Mix” is massive.
It sells Personal Care (Dant Kanti, Soaps, Shampoos).
It sells Food Products (Atta, Ghee, Biscuits, Noodles).
It sells Home Care (Dishwash bar, Detergents).
It sells Medicines (Ayurvedic supplements).
2. Nestlé India: Nestlé is a classic example of a deep and wide product mix.
A product mix is defined by four dimensions: Width, Length, Depth, and Consistency.
1. Product Mix Width (Breadth)
This refers to the number of different product lines the company carries.
Example: Patanjali has a wide mix because it deals in Medicine, Cosmetics, Grocery, and Garments (Paridhan).
Strategy: Companies increase width to diversify risk and capitalize on their brand reputation.
2. Product Mix Length
This refers to the total number of items in the mix. It is the sum of all the products within all the lines.
Example: If Nestlé has 5 milk products, 5 beverages, and 10 chocolates, the “Length” of its mix is 20.
3. Product Mix Depth
This refers to the number of versions offered of each product in the line. It includes different sizes, flavors, and formulations.
Example:Maggi Noodles comes in Masala, Chicken, Atta, Oats, and varied pack sizes (single pack, family pack). This variety represents the depth of the Maggi line.
4. Product Mix Consistency
This refers to how closely related the various product lines are in end-use, production requirements, or distribution channels.
Example:Amul has high consistency because almost all its products (Milk, Butter, Cheese, Ice Cream) are dairy-based and use a cold-chain distribution network.
Example:Samsung has lower consistency because it sells everything from Smartphones (Consumer Electronics) to Heavy Ships and Insurance.
Product Line Decisions
A Product Line is a group of products that are closely related because they function in a similar manner, are sold to the same customer groups, or fall within given price ranges. Product managers must constantly decide whether to expand or cut their product lines.
1. Line Stretching
This occurs when a company lengthens its product line beyond its current range. This can be done in three ways:
Downward Stretch: A company located at the upper end of the market introduces a lower-priced line.
Reason: To plug a market hole that would otherwise attract a new competitor or to respond to an attack on the high end.
Example:Mercedes-Benz introducing the A-Class (a smaller, cheaper car) to compete in the lower-luxury segment.
Risk: It might cheapen the brand image.
Upward Stretch: Companies at the lower end of the market may enter the higher end.
Reason: Higher margins and faster growth rates at the top.
Example:Maruti Suzuki, known for budget cars (Alto, WagonR), launched the Nexa channel to sell premium cars like the Ciaz and Grand Vitara.
Risk: Customers may not believe the “budget” brand can produce “premium” quality.
Both-Way Stretch: Companies in the middle range may decide to stretch their line in both directions.
Example:Titan Watches sells Sonata for the budget segment and Nebula (gold watches) for the luxury segment, while keeping Titan in the middle.
2. Line Filling
This involves adding more items within the existing range of the product line.
Reason: To reach for incremental profits, satisfy dealers who complain about missing items, utilize excess capacity, or keep out competitors.
Risk: If overdone, it results in “cannibalization” (new products eating the sales of old ones) and customer confusion.
3. Line Pruning
The opposite of stretching. This involves cutting down the number of items in the product line.
Reason: When products are dead weight (unprofitable) or when production capacity is short.
Example:P&G significantly pruned its “Head & Shoulders” shampoo line from 31 items down to 15 to reduce complexity and focus on best-sellers.
New Product Development (NPD) Process
Innovation is key to survival. However, new products have a high failure rate. To minimize risk, companies follow a systematic New Product Development (NPD) process.
The 7 Stages of NPD:
Idea Generation: The systematic search for new product ideas. Sources include internal employees, customers, competitors, and distributors.
Idea Screening: Filtering the ideas to spot good ones and drop poor ones as soon as possible. (e.g., Is it feasible? Is there a market?).
Concept Development & Testing: A “product idea” is a possible product; a “product concept” is a detailed version of the idea stated in meaningful consumer terms. This concept is then tested with a group of target consumers to gauge their reaction.
Business Analysis: A review of the sales, costs, and profit projections for a new product to find out whether they satisfy the company’s objectives.
Product Development: Turning the product concept into a physical product (prototype) to ensure the idea is workable and safe. This involves R&D and engineering.
Test Marketing: Introducing the product and marketing program into realistic market settings (a few select cities) to test consumer response before a full-blown launch.
Commercialization: The full-scale launch of the product into the market. This involves high costs for advertising and distribution.
The Product Life Cycle (PLC)
The Product Life Cycle (PLC) is a concept that describes the stages a product goes through from when it was first thought of until it finally is removed from the market.
According to Philip Kotler:
“The PLC is an attempt to recognize distinct stages in the sales history of the product… corresponding to these stages are distinct opportunities and problems with respect to marketing strategy and profit potential.”
!
Shutterstock
Explore
The PLC typically has four stages: Introduction, Growth, Maturity, and Decline.
Stage 1: Introduction Stage
This starts when the new product is first launched.
Sales: Low and slow. It takes time for the product to roll out to markets and for dealers to stock it.
Profits: Negative or low. Distribution and promotion expenses are at their highest.
Competition: Low. Few or no competitors.
Marketing Objective: Create product awareness and trial.
Strategic Decisions in Introduction:
Rapid Skimming Strategy: Launching at a High Price with High Promotion. (Example: Apple iPhone launches).
Slow Skimming Strategy: Launching at a High Price with Low Promotion. Used when the market size is limited and competition is not expected soon.
Rapid Penetration Strategy: Launching at a Low Price with High Promotion. Used to capture a large market share quickly in a price-sensitive market. (Example: Reliance Jio launch).
Slow Penetration Strategy: Launching at a Low Price with Low Promotion. Used when the market is price sensitive but not promotion sensitive.
Stage 2: Growth Stage
If the new product satisfies the market, it enters the growth stage.
Sales: Climb rapidly. Early adopters continue buying, and more consumers follow.
Profits: Increase rapidly as promotion costs are spread over a larger volume and unit manufacturing costs fall.
Competition: New competitors enter, attracted by the opportunities for profit. They introduce new product features.
Strategies for Growth:
Product Improvement: Improve quality and add new product features or styling.
New Models: Add new models and flanker products (different sizes, flavors) to protect the main product.
New Segments: Enter new market segments.
New Channels: Enter new distribution channels (e.g., moving from online-only to retail stores).
Shift in Advertising: Shift from building product awareness to building product conviction and purchase.
Price Cuts: Lower prices slightly to attract the next layer of price-sensitive buyers.
Stage 3: Maturity Stage
This is the longest stage for most products. Sales growth slows down or plateaus.
Sales: Peak sales. The market is saturated (most people who want the product already have it).
Profits: Begin to decline. Competition is fierce, leading to price wars and increased advertising spending to defend market share.
Competition: Intense. Weak competitors drop out.
Strategies for Maturity:
Market Modification: Try to increase consumption by finding new users or new segments (e.g., Johnson & Johnson marketing baby oil to adults).
Product Modification: Change characteristics such as quality, features, or style to attract new users (e.g., Car manufacturers launching “facelift” versions of existing models).
Marketing Mix Modification:
Price: Cut prices to match competitors.
Distribution: Seek more outlets.
Promotion: Use aggressive sales promotion (contests, discounts).
Stage 4: Decline Stage
The sales of most product forms and brands eventually dip. This can happen slowly (oatmeal) or rapidly (VHS tapes).
Sales: Declining.
Profits: Eroding.
Reason for Decline: Technological advances (CDs replacing Cassettes), shifts in consumer tastes, or increased competition.
Strategies for Decline:
Maintain: Continue hoping that competitors will leave the industry. (Example: P&G remained in the liquid soap business while others withdrew, eventually making good profits).
Harvest: Reduce various costs (R&D, advertising, sales force) and hope that sales hold up. This is also called “milking the brand.”
Divest: Drop the product from the line. Sell it to another firm or liquidate it.
Example Case Study:
Introduction: 3G Mobile Phones (High price, low awareness initially).
Growth: 4G Smartphones (Rapid adoption, many competitors like Samsung, Apple, Xiaomi).
Maturity: Laptops (Everyone has one, competition is on price and minor features).
Decline: Landline Telephones / Typewriters (Replaced by newer tech.
Product Improvement & Diversification
Companies cannot rely on one product forever. They must improve existing products and find new markets.
Product Improvement
This is the process of making meaningful changes to an existing product to satisfy customers better or combat competition. Unlike NPD, this focuses on upgrading what you already have.
Why Improve Products?
To extend the Product Life Cycle (especially during the Maturity stage).
To create a “new” talking point for advertising (e.g., “New and Improved Formula”).
To fix customer complaints or defects.
3 Main Strategies for Product Improvement:
Quality Improvement: Increasing the durability, reliability, or speed. (e.g., A smartphone using stronger glass).
Feature Improvement: Adding new functions that make the product more versatile or safe. (e.g., WhatsApp adding “Delete for Everyone”).
Style/Aesthetic Improvement: Changing the look, feel, or color without changing functional performance. (e.g., A car facelift with new headlights).
Product Diversification
Diversification is a growth strategy where a company enters a new market with a new product. It is high-risk but high-reward.
Types of Diversification:
Concentric Diversification: Adding new products that are related to existing products (technology/marketing). Example: A shoe company starting a line of socks.
Horizontal Diversification: Adding new products that are unrelated to current products but appeal to the same customer group. Example: A gym selling protein shakes.
Conglomerate Diversification: Adding new products that are totally unrelated to current products and markets. Example: Tata Group moving from Steel to Salt to Software.
We’re constantly updating this page with the latest notes for every Student. Bookmark this page so you can easily find lu notes again, all in one place!
Found a mistake or have a suggestion? We work hard to ensure all notes are 100% accurate. If you spot an error, find a missing subject, or have a request, please [click here to let us know]! (You can link this text to your contact page or WhatsApp).
In marketing, the consumer is king. Understanding why, when, and how consumers buy is the most critical task for any marketing manager. Consumer Behavior is the study of the acts of individuals involved in obtaining and using goods and services, including the decision-making processes that precede and follow these acts.
The goal is to answer the ultimate question: Why does a consumer buy?
1. Types of Consumer Markets
Consumer markets can be categorized based on the products they sell:
Fast-Moving Consumer Goods (FMCG): Low value, high volume, and fast repurchase (e.g., Soaps, Juices, Chocolates).
Consumer Durables: High value, low volume, and used for a long time (e.g., TV, Fridge, Gaming Consoles).
Soft Goods: Similar to durables but wear out faster (e.g., Clothes, Shoes).
Markets can also be classified by Area (Local, National, International), Time (Short/Long period), and Competition (Perfect, Imperfect).
2. Types of Customers in the Market
Not all customers behave the same way. Based on purchase habits, we can identify five types:
Loyal Customers: They buy the same brand repeatedly. Marketers must communicate with them regularly to keep them happy, as they are likely to recommend the brand to others.
Discount Customers: They buy based on price or sales. They help turnover inventory but can increase costs due to higher return rates.
Impulse Customers: They make purchase decisions at the moment of buying (e.g., picking up a candy bar at checkout). They are a great source of insight.
Need-Based Customers: They buy only to fulfill a specific need. If they don’t find what they need, they leave immediately. They are harder to please but are the greatest source of long-term growth.
Wandering Customers: They make up the largest traffic in a retail store but the smallest percentage of sales. They visit stores more for the experience or location than to buy.
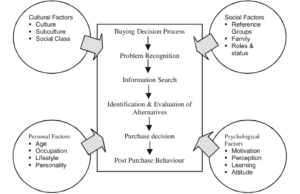
The Consumer Buying Decision Process (5 Stages)
A consumer goes through a specific journey before making a purchase.
Credit : Shutterstock
Stage 1: Need Recognition & Problem Awareness
The process starts when a consumer realizes a gap between their current state and their desired state.
Internal Stimuli: Hunger, thirst, or basic needs.
External Stimuli: Seeing an ad, smelling food, or admiring a friend’s new car.
Marketer’s Job: Identify the drive (motive) and arrange cues to trigger this need.
Stage 2: Information Search
Once the need is aroused, the consumer looks for information.
Internal Search: Memory and past experiences.
External Search:
Personal Sources: Family, friends (Most effective).
Experiential Sources: Handling or examining the product.
Stage 3: Evaluation of Alternatives
The consumer compares different brands based on product attributes (price, quality, features).
Cognitive Evaluation: Based on logic and objective criteria.
Affective Evaluation: Based on emotions and feelings.
Stage 4: Purchase Decision
The consumer forms an intention to buy. However, two factors can still interfere:
Attitude of Others: (e.g., a spouse disapproving of the purchase).
Unanticipated Situational Factors: (e.g., sudden job loss or the store is out of stock).
Stage 5: Post-Purchase Behavior
After buying, the consumer compares the product’s performance to their expectations.
Performance < Expectations: Dissatisfaction.
Performance = Expectations: Satisfaction.
Performance > Expectations: Delight.
Note: If a consumer is dissatisfied, they may return to Stage 1 but will likely exclude the brand they just bought from future choices.
Factors Influencing Consumer Behavior
A consumer’s decision is never made in isolation. It is influenced by four major factors.
1. Cultural Factors (The Broadest Influence)
Culture: The set of basic values, perceptions, and behaviors learned from family and society. (e.g., Indian culture values family and savings; American culture values individualism and consumerism).
Sub-Culture: Smaller groups with shared value systems (e.g., Punjabi vs. South Indian culture).
Social Class: Society’s ordered divisions (Upper, Middle, Lower) whose members share similar values and behaviors.
2. Social Factors
Reference Groups: Groups that influence a person’s behavior (e.g., friends, co-workers). Marketers try to target “Opinion Leaders” within these groups.
Family: The most important consumer buying organization in society. Buying roles are changing (e.g., children influencing car purchases).
Roles & Status: A person plays different roles (e.g., a father vs. a CEO). Each role carries a status that influences clothing, car, and lifestyle choices.
3. Personal Factors
Age & Life Cycle Stage: Tastes change with age. A bachelor’s spending differs vastly from a “Full Nest” family with young children.
Occupation: A blue-collar worker buys work clothes; a CEO buys suits.
Lifestyle: A person’s pattern of living as expressed in their AIO (Activities, Interests, Opinions).
Economic Situation: Income, savings, and borrowing power affect product choice.
4. Psychological Factors
Motivation: A need becomes a motive when it is strong enough to drive action.
Maslow’s Hierarchy of Needs: Explains that people satisfy needs in a specific order: Physiological -> Safety -> Social -> Esteem -> Self-Actualization.
Shutterstock
Perception: How we select and interpret information. (e.g., If you perceive a brand as “premium,” you act accordingly).
Learning: Changes in behavior arising from experience.
Beliefs & Attitudes: Descriptive thoughts (beliefs) and enduring evaluations (attitudes) about brands. These are hard to change.
Summary: Why Study Consumer Behavior?
To segment the market effectively.
To design a better marketing mix (Product, Price, Place, Promotion).
To assess new market opportunities.
Ultimately, because The Consumer is King. Ignoring their preferences leads to failure.
“Financial Management” is often considered the backbone of the BBA curriculum and appears in the 3rd Semester of exams. This subject moves from simple accounting to teach you the methodologies of decision-making: How do companies decide where to invest? How do they raise money? How do they manage cash?
Lu notes has organized the complete syllabus into easy-to-understand notes to help you master these calculations and concepts. Just click on your desired topic below to access the notes!
Unit 1: Introduction & Investment Decisions
This unit covers the basics of finance and the crucial tools for deciding long-term investments.
Introduction to Financial Management: Concept, Functions, Objectives, Profitability vs. Shareholder Wealth Maximization [View Notes]
Time Value of Money- Compounding & Discounting [View Notes]
Investment Decisions: Capital Budgeting (Payback, NPV, IRR, ARR) [View Notes]
Unit 2: Financing Decisions
This unit focuses on how companies raise funds and the cost associated with those funds.
Consequences and Remedies of Over and Under Capitalization (I have already explained this topic in the first article “Introduction to Financial Management.” Please visit that article, and you will find the detailed explanation below in that post.
Cost of Capital & WACC (Weighted Average Cost of Capital) [View Notes]
Determinants of Capital Structure [View Notes]
Capital Structure Theories [View Notes]
Unit 3: Dividend Decisions
This unit explores how companies decide how much profit to keep and how much to give back to shareholders.
Dividend Decision: Concept and Relevance [View Notes]
Dividend Models: Walter’s Model [View Notes]
Dividend Models: Gordon’s Model [View Notes]
Dividend Models: MM Hypothesis (Modigliani-Miller) [View Notes]
Dividend Policy and its Determinants [View Notes]
Unit 4: Working Capital Management
The final unit deals with the day-to-day financial health of a business.
Management of Working Capital: Concepts & Approaches [View Notes]
Management of Cash [View Notes]
Management of Receivables [View Notes]
Management of Inventory [View Notes]
CREDIT : Shutterstock
📚 Keep Studying!
We hope these Financial Management notes help you master the numbers and ace your exams. LuNotes is your one-stop solution for all Lucknow University notes. Don’t forget to check out our notes for other subjects in your semester!
[Link to Marketing Management Notes]
[Link to Human Resource Management Notes]
[Link to Operations Management Notes]
Found a mistake? We work hard to ensure all notes are 100% accurate and as per the latest LU syllabus. If you spot an error, find a missing subject, or have a request, please [click here to let us know]! (You can link this text to your contact page or WhatsApp).
By LuNotes – your trusted for Lucknow University Semester exam notes, crafted with love. ❤️
“Human Resource Management” (Code: 3P14) is one of the most vital subjects in your management career. It goes beyond just hiring and firing; it teaches you how to manage the most valuable asset of any organization—its people. From motivation to conflict resolution, this subject shapes you into a leader.
We’ve organized the complete NEP syllabus (w.e.f. July 2024) into easy-to-understand notes. Whether you need to understand the difference between HRM and Personnel Management or master the art of Collective Bargaining, everything is covered here. Just click on your desired topic below to access the notes!
Unit 1: Introduction to HRM & Planning
This unit sets the stage by defining what HRM is and how it has evolved from traditional personnel management. It also covers how companies plan their workforce needs.
Personnel vs. Human Resource Management, Significance, Functions, and Objectives of HRM, Evolution and Development of HRM [View Notes]
Human Resource Planning: Process & Strategic Integration & Job Analysis: Concept and Components [View Notes]
Unit 2: Recruitment, Selection & Training
This unit focuses on the practical aspect of acquiring talent and sharpening their skills to fit the organization’s goals.
We hope these Human Resource Management notes help you ace your exams and understand how to manage people effectively. LuNotes is your one-stop solution for all Lucknow University BBA notes. Don’t forget to check out our notes for other subjects in your 3rd Semester!
[Link to BBA Advertising Management Notes]
[Link to BBA Banking Operations Management Notes]
[Link to BBA Management Information System Notes]
Found a mistake? We work hard to ensure all notes are 100% accurate and as per the latest LU NEP syllabus. If you spot an error, find a missing topic, or have a request, please [click here to let us know]!
By Lu Notes – your trusted partner for Lucknow University Semester exam notes, crafted with love. ❤️
Capital Budgeting is the planning process used by firms to evaluate and select major longterm investments. These decisions involve large expenditures on fixed assets like buying new machinery, constructing a factory or developing a new product.
It results in a Capital Budget—the firm’s formal plan for its outlay on fixed assets.
Why is Capital Budgeting Important?
Affects Profitability: A good investment can yield spectacular returns, while a bad one can endanger the firm’s survival.
Long-Term Effects: The impact of these decisions is felt over many years (e.g., a new factory changes the cost structure for decades).
Irreversibility: Once made, these decisions are hard to reverse without huge financial loss.
Huge Investment: It involves substantial capital, ranging from thousands to crores of rupees.
Scarcity of Resources: Capital is limited. Firms must choose the best project among many options.
🔄 The Capital Budgeting Process
A capital budgeting decision is a two-sided process:
Calculate Expected Return: Estimating the cash outflows (costs) and the stream of future cash inflows (benefits).
Select Required Return: Determining the minimum return the project must earn to be acceptable (based on risk).
Critical Rules for Estimating Cash Flows
Only Cash Flow Matters: We look at actual cash, not accounting profit. To find Cash Inflow, we add non-cash expenses (like depreciation) back to the profit after tax.
Cash Inflow = Profit After Tax + Depreciation
Ignore Sunk Costs: Money already spent in the past is irrelevant.
Include Opportunity Costs: If a project uses a resource you already own, the money you could have earned by selling or renting it is a cost.
Consider Working Capital: Projects often require extra inventory or cash on hand. This is an initial outflow and a final inflow when the project ends.
Ignore Interest: Do not deduct interest payments when estimating cash flows; the cost of capital (discount rate) accounts for this.
📊 Techniques for Evaluation: Traditional vs. Discounted
There are two main categories of techniques used to evaluate investment proposals.
A. Traditional Techniques (Non-Discounted)
These methods are simple but ignore the time value of money (i.e., they assume ₹1 today is worth the same as ₹1 in five years).
1. Payback Period Method
This determines how long it takes for a project to recover its initial investment cost.
Formula:Payback Period = Cost of Project / Annual Cash Inflow
Decision Rule: Accept the project with the shorter payback period.
🧮 Numerical Example: Payback Period
Problem: A project costing ₹20 Lakhs yields an annual profit of ₹3 Lakhs after depreciation (@12.5% SLM) but before tax (50%). Calculate the Payback Period.
Solution:
First, we must find the Annual Cash Inflow.
Depreciation: Let’s assume depreciation is ₹2,00,000.
Profit Before Tax: ₹3,00,000
Less Tax (50%): ₹1,50,000
Profit After Tax: ₹1,50,000
Add Back Depreciation: + ₹2,00,000 (Because it’s a non-cash expense)
Annual Cash Inflow:₹3,50,000(Note: The text example used ₹4,00,000 as the final inflow figure to arrive at 5 years. Let’s use the text’s final figures for clarity).
This is a simple method to estimate the internal rate of return. It is calculated as 1 ÷ Payback Period.
🧮 Numerical Example:
Initial Cash Outlay: ₹2,00,000
Annual Cash Savings: ₹50,000
Payback Period = 2,00,000 / 50,000 = 4 Years
Payback Reciprocal = 1 / 4 = 25%
3. Accounting Rate of Return (ARR)
This method uses accounting profit (not cash flow) to calculate return on investment.
Formula:ARR = (Average Annual Profit / Average Investment) x 100
Limitations: Ignores time value of money; based on accounting profits which can be manipulated.
B. Discounted Cash Flow (DCF) Techniques
These methods are superior because they consider the Time Value of Money. They discount future cash flows to their Present Value (PV) using a specific interest rate (Cost of Capital).
4. Net Present Value (NPV)
This is the most reliable method. It calculates the total present value of all future cash inflows minus the initial cash outflow.
Decision Rule: If NPV > 0, Accept the project (It adds value to the firm).
🧮 Numerical Example: NPV
Problem: JP Company wants to buy a machine costing ₹33,522. It will generate annual cash savings of ₹10,000 for 5 years. The company’s cost of capital is 12%.
Solution:
We need to find the Present Value (PV) of the 5 annual payments of ₹10,000.
PV Factor for annuity of 5 years @ 12% = 3.605
Calculation Step
Value (₹)
PV of Cash Inflows (10,000 × 3.605)
36,050
Less: PV of Cash Outflows (Cost)
(33,522)
Net Present Value (NPV)
2,528
Conclusion: Since the NPV is positive (₹2,528), the project is acceptable.
5. Profitability Index (PI)
Also called the Desirability Factor. It measures the ratio of benefits to costs.
Formula:PI = PV of Cash Inflows / PV of Cash Outflows
Decision Rule: Accept if PI > 1.
6. Internal Rate of Return (IRR)
This is the exact discount rate that makes the NPV equal to zero. It represents the project’s actual rate of return.
Decision Rule: Accept if IRR > Cost of Capital.
🚧 Capital Rationing
Sometimes, a firm has more profitable projects than it has money to fund. This is called Capital Rationing. The goal is to select the combination of projects that fits within the budget and maximizes value.
🧮 Numerical Example: Capital Rationing
Problem: S. Ltd. has ₹10,00,000 allocated. Which projects should they choose?
Project
Investment (₹)
Profitability Index (PI)
1
3,00,000
1.22
2
1,50,000
0.95
3
3,50,000
1.20
4
4,50,000
1.18
5
2,00,000
1.20
6
4,00,000
1.05
Solution:
Rank projects by PI (highest to lowest) and select until the budget is full.
Rank 1: Project 1 (PI 1.22) – Cost ₹3,00,000
Rank 2: Project 3 (PI 1.20) – Cost ₹3,50,000
Rank 3: Project 5 (PI 1.20) – Cost ₹2,00,000
Total Cost so far: ₹8,50,000
Remaining Budget: ₹1,50,000
Next Best: Project 4 (PI 1.18) costs ₹4,50,000. We cannot afford it.
Optimal Combination: Projects 1, 3, and 5.
⚠️ Dealing with Risk in Capital Budgeting
Risk refers to the chance that a project will prove unacceptable (NPV < 0).
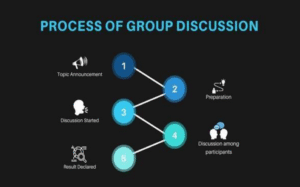
A Group Discussion (GD) is a dynamic and interactive technique where a small group of people discusses a specific topic, exchanges ideas and expresses opinions. It is commonly used in educational institutions and corporate recruitment to assess a candidate’s overall personality, including their ability to think critically, communicate effectively and work collaboratively.
The main goal of a GD is to reach a reasonable conclusion or solution through collaboration and discussions.
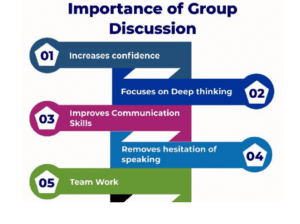
Why Group Discussions are important?
Group discussions are an essential tool for personal growth, intellectual development and professional skill enhancement.
Enhances Critical Thinking: GDs encourage participants to think analytically, evaluate arguments, identify logical flaws and make decisions based on evidence rather than assumptions.
Improves Communication Skills: Participants learn to express thoughts clearly and confidently, listen actively and articulate viewpoints persuasively a skill valuable in personal and professional settings.
Fosters Collaboration and Teamwork: Individuals learn to respect diverse opinions, compromise and build upon each other’s ideas to achieve common goals.
Problem Solving and Decision Making: By brainstorming solutions and considering various perspectives, a group can arrive at more well rounded and innovative outcomes than a single person.
Confidence Building: Regular participation helps individuals overcome the fear of public speaking and boosts self-confidence and assertiveness.
Prepares for Interviews: GDs simulate real-life scenarios, helping participants practice for job interviews and professional debates.
What are some Essential Skills for Effective GD?
Effective group discussions require participants to possess a variety of skills that contribute to productive and constructive communication.
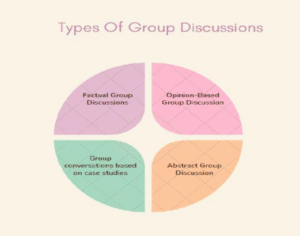
What are types of Group Discussion Topics?
Factual Group Discussions: Focuses on real-world, current events or socioeconomic concerns (e.g., “The impact of the new GST law or Impact of new tax regime”). These test your ability to digest information and analyze facts.
Opinion-Based Group Discussions: Focus on beliefs and viewpoints where there is no right or wrong answer (e.g., “Does mobile phone makes us anxiety prone?”). These test your articulation and persuasion skills.
Group Conversations based on Case Studies: Mimic real world business circumstances. The group is given a fictitious scenario and must work together to identify the problem and propose a solution.
Abstract Group Discussion: Focus on abstract, creative concepts (e.g., “The Color Red” or “The difference between success and failure”). These test your originality, lateral thinking and ability to associate different concepts.
How to Generate Strong Points for a Group Discussion?
1. Start with Brainstorming Begin by writing down every idea that comes to mind about the topic. Don’t filter or judge anything at this stage just note everything. You can sort and refine the ideas later.
2. Do Proper Research Read articles, books and trusted online sources to understand the topic better. Collect facts, viewpoints, and examples so you can speak with confidence during the discussion.
3. Use Examples and Analogies To make your points more relatable support them with real life examples, case studies or comparisons. This helps others understand your perspective clearly.
4. Prioritize Your Best Points After gathering ideas, choose the most relevant and strongest points. Focus on what adds real value to the discussion rather than trying to cover everything.
5. Practice Your Points Before the actual GD, rehearse how you will present your points. Rearrange them if needed so they flow logically. If possible, get feedback from friends or classmates.
6. Create a Mind Map Make a simple diagram starting with the main topic and branching into subtopics. This gives you a clear visual structure and may even help you discover new points.
7. Use the 5W + 1H Method Ask questions like Who, What, When, Where, Why and How to explore the topic from multiple angles. For example, if the topic is climate change, ask:
Why is it happening?
How can we reduce it?
Who is most affected?
8. Problem Solution Breakdown If the topic involves an issue, identify the core problems and suggest practical solutions. This shows critical thinking and a constructive approach.
9. Consider Environmental Impact For topics related to nature or sustainability, think about how the issue affects ecosystems, resources, and climate. Highlight the need for eco friendly and sustainable actions.
10. Consider Social Impact Look at how the topic affects society, especially different communities or groups. This helps bring in points about equality, inclusiveness and social responsibility.
What are some Essential Skills for Effective GD?
Effective group discussions require participants to possess a variety of skills that contribute to productive and constructive communication.
Skill Required
How It Helps in a GD
Active Listening
Focus on what others are saying without interrupting in between. It shows respect and allows you to build logically on the ideas presented by others and then answer accordingly.
Critical Thinking
Analyze information and evaluate arguments carefully. This helps you identify the strengths and weaknesses of different perspectives.
Clarity of Thought
Organize your thoughts before speaking. Present your ideas in a structured, coherent and concise manner which will make others attentive to your words.
Flexibility
Be open minded and willing to adapt your viewpoint based on new evidence or logical reasoning presented by others don’t be rigid.
Empathy and Respect
Value different viewpoints, even if they differ from your own. Avoid personal attacks and maintain an inclusive environment.
Time Management
Stay mindful of time constraints. Prioritize your arguments and ensure the discussion stays focused on the main topic.
Body Language Awareness
Use non-verbal cues (eye contact, nodding, open gestures) to convey engagement and professionalism.
What are some Rules of Conduct for GDs? (Do’s and Don’ts)
A respectful and open atmosphere is essential for a productive and good GD.
✅ The DOs (What to Practice)
Prepare: Familiarize yourself with the topic and gather relevant information beforehand so that you are prepared.
Listen Actively: Pay attention to others’ viewpoints. Use summarizing or paraphrasing to ensure you understand and to show respect for their input.
Speak Respectfully: Express your thoughts politely and tactfully dont argue.
Stay on Topic: Keep the discussion focused on the main subject and prioritize your arguments.
Seek Consensus: Look for areas of agreement or common ground to move the discussion towards a solution.
Use Effective Phrases: Use phrases to manage the flow and promote inclusion:
To Summarize: “Let’s quickly summarize…”
To Promote Inclusion: “Does anyone have a different viewpoint?”
To Guide Focus: “Let’s focus on the main topic…”
❌ The DON’Ts (What to Avoid)
Don’t Interrupt or Dominate: Allow everyone to express their thoughts. Dominating the conversation discourages others from participating and others will also be reluctant while listening you.
Don’t Rush to Judgment: Take time to hear different viewpoints before forming conclusions. Be open to changing your perspective.
Don’t Be Dismissive: Avoid belittling others’ ideas or opinions, even if you disagree. Respectful disagreement is encouraged.
Don’t Use Offensive Language: Refrain from using inflammatory language that may create tension within the group.
Don’t Engage in Side Conversations: Avoid having unrelated conversations with a subset of participants, as this is distracting and exclusive.
Don’t Slouch: Use positive body language. Avoid distractions like using your phone or fidgeting or ignoring.
Found a mistake? We work hard to ensure all notes are 100% accurate but please comment below your queries or questions we are always there to help you.
“Interview Preparation & Planning” is likely the most career-defining subject in your BBA curriculum. It makes you prepare by using your academic knowledge into your Practical employability, teaching you how exactly you land up a good high paying job.
We as lunotes have organized the complete syllabus of all 4 units into easy-to-understand onpoint notes to help you crack your dream job.
Just click on your desired topic (view notes) below to Start learning now for your semester exams!
Unit 1: CV and Resume Writing
This unit focuses on how to craft the perfect document to market yourself to employers.
CV writing skill |How to avoid Typos, Howlers, Boast, and Bravado in CVs | Making of Resume/C.V | Dos & Don’ts of working document (3 topics in one article)[View Notes]
Unit 2: Interview Preparation
This unit prepares you for the verbal aspect of the hiring process, focusing on knowledge and presentation.
Role and Significance of General Knowledge and General Awareness [View Notes]
We hope these Interview Preparation & Planning notes help you land your dream placement. LuNotes is your one-stop solution for all Lucknow University notes. Don’t forget to check out our notes for other subjects in your semester!
[Link to Human Resource Management Notes]
[Link to Marketing Management Notes]
[Link to Financial Management Notes]
Found a mistake? We work hard to ensure all notes are 100% accurate and as per the latest LU syllabus. If you spot an error, find a missing subject, or have a request, please [click here to let us know]!
By Lu Notes – your trusted for Lucknow University Semester exam notes, crafted with love. ❤️
The accounting process involves identifying, recording, and then summarizing financial transactions. The first two steps of this process are Recording (in a Journal) and Classifying (in a Ledger).
This guide covers the entire process, from understanding the Golden Rules of Accounting to creating journal entries and posting them to ledger accounts.
Part 1: The Journal (The Book of Original Entry)
In accounting, a Journal is the very first book where all day-to-day business transactions are recorded. Because it’s the first place transactions are entered, it is known as the ‘Book of Original Record’ or ‘Book of Primary Entry’.
The word “Journal” comes from the French word ‘Jour’, which means “day.” Transactions are recorded in chronological order (in the order they occur). The act of recording a transaction in the journal is called “Journalising”.
Golden Rules of Accounting (How to Debit and Credit)
To “journalize” a transaction, you must know what to debit (Dr.) and what to credit (Cr.). The rules for this are based on the three types of accounts:
Personal Account
What it is: Accounts for all persons, firms, companies, and representative groups (e.g., Mr. Kamlesh’s A/c, SBI Bank A/c, Outstanding Salary A/c).
The Rule:
Debit the Receiver
Credit the Giver
Real Account
What it is: Accounts for all assets and properties the business owns (e.g., Cash, Machinery, Furniture, Goodwill).
The Rule:
Debit What Comes In
Credit What Goes Out
Nominal Account
What it is: Accounts for all expenses, losses, incomes, and gains (e.g., Salary A/c, Rent A/c, Interest Received A/c, Sales A/c).
The Rule:
Debit All Expenses and Losses
Credit All Incomes and Gains
How to Pass a Journal Entry (Proforma)
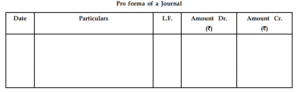
A journal entry is a systematic record of a transaction. The account to be debited is written first with “Dr.” at the end. The account to be credited is written on the next line, indented, and starts with the word “To”.
This is the standard format (or “proforma”) of a journal:
Proforma of a Journal
| Date | Particulars | L.F. | Amount (Dr.) | Amount (Cr.) |
| :— | :— | :— | :— | :— |
| (Date) | (Account to be Debited) …Dr. | | (Amount) | |
| | To (Account to be Credited) | | | (Amount) |
| | (Being the narration, or explanation of the entry) | | | |
L.F. (Ledger Folio): This column is used to write the page number of the Ledger book where this entry is posted.
Special Types of Journal Entries
1. Compound Journal Entry
A Compound Entry is a single journal entry that involves more than two accounts (e.g., more than one debit and/or more than one credit). This is used when two or more transactions of a similar nature happen on the same day.
Example: On Aug 10, you sold goods to ‘Y’ & Co. for ₹30,000 and received ₹20,000 in cash immediately.
Journal Entry
Date
Particulars
L.F.
Dr. (₹)
Cr. (₹)
Aug 10
Cash A/c … Dr.
20,000
Y & Co.’s A/c … Dr.
10,000
To Sales A/c
30,000
(Being goods sold and partial payment received)
2. Opening Journal Entry
An Opening Entry is the very first entry passed in the journal at the beginning of a new financial year. Its purpose is to record all the closing balances of assets and liabilities from the previous year’s Balance Sheet. All Assets are debited, and all Liabilities and Capital are credited.
Example: Pass the opening entry on Jan 1, 2006, for Gopinath.
Cash: ₹3,000
Bank: ₹16,000
Stock: ₹30,000
Furniture: ₹5,000
Debtors: ₹21,000
Creditors: ₹18,000
Loan from Ganesh: ₹9,000
The Entry:
Opening Entry – 1 Jan 2006
Date
Particulars
L.F.
Amount (Dr.) (₹)
Amount (Cr.) (₹)
2006
Jan 1
Cash in Hand A/c … Dr.
3,000
Cash at Bank A/c … Dr.
16,000
Stock in Trade A/c … Dr.
30,000
Furniture & Fittings A/c … Dr.
5,000
Sundry Debtors A/c … Dr.
21,000
To Sundry Creditors A/c
18,000
To Ganesh & Co. A/c
9,000
To Capital A/c (Balancing Figure)
48,000
(Being opening balances brought forward)
Part 2: Subsidiary Books (The Sub-division of Journal)
If a business is large, it will have thousands of repetitive transactions (like sales, purchases, and cash payments). Recording every single one in the main Journal would make it too bulky and hard to manage.
To solve this, the Journal is sub-divided into special journals, which are called Subsidiary Books. Each book is used to record one specific type of repetitive transaction.
The 8 Key Subsidiary Books
Cash Book: Records ALL transactions involving cash and bank (receipts and payments). It has both a debit and credit side and acts as both a journal and a ledger account.
Purchase Book (Purchase Day Book): Records ONLY credit purchases of goods (the items you buy to resell).
Sales Book (Sales Day Book): Records ONLY credit sales of goods.
Purchase Return Book (Return Outward Book): Records goods returned to suppliers. This is often based on a Debit Note.
Sales Return Book (Return Inward Book): Records goods returned by customers. This is often based on a Credit Note.
Bills Receivable Book: Records all Bills of Exchange and Promissory Notes received from debtors.
Bills Payable Book: Records all Bills of Exchange and Promissory Notes accepted (to be paid to) creditors.
Journal Proper (or General Journal): This is the “real” journal. It is used to record all transactions that cannot be recorded in any of the other 7 subsidiary books.
What Goes into the Journal Proper?
The Journal Proper is used for all non-repetitive, non-cash, and non-goods transactions. This includes:
Opening Entries (as shown above)
Closing Entries (at the end of the year)
Adjustment Entries (e.g., for depreciation, outstanding salaries)
Rectification Entries (to correct mistakes)
Credit Purchase/Sale of Assets:
If you buy Goods on credit, it goes in the Purchase Book.
If you buy Furniture on credit, it goes in the Journal Proper. (Entry: Furniture A/c ...Dr. / To Supplier's A/c)
Part 3: The Ledger (The Principal Book of Accounts)
While the Journal records transactions as they happen, it doesn’t provide a complete picture of an account. A Journal doesn’t answer queries like:
How much is the total amount due from a specific debtor?
How much do we owe to a specific creditor?
What is the total balance of our Cash account?
To answer these, we prepare the Ledger. The Ledger is the principal book of accounts where all transactions from the journal are classified and grouped into individual accounts. It is a set of all accounts (Personal, Real, and Nominal).
Forms of Ledger
Bound Ledger: The traditional method where the ledger is a single, bound notebook.
Loose-Leaf Ledger: A more modern and flexible method where each account is on a separate, loose sheet. This allows for new pages to be added, old accounts to be removed, and accounts to be easily rearranged.
Part 4: Posting (From Journal to Ledger)
Posting is the process of transferring entries from the Journal (or Subsidiary Books) to their respective accounts in the Ledger.
If a journal entry debits the Rent Account, posting involves going to the Rent Account in the ledger and recording that amount on its debit side.
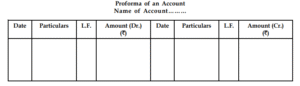
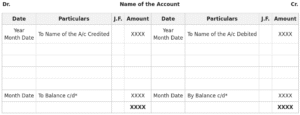
Proforma of a Ledger Account
A ledger account is presented in a “T” format, with a debit (Dr.) side on the left and a credit (Cr.) side on the right.
Dr. (Debit Side) Name of Account Cr. (Credit Side)
| Date | Particulars | J.F. | Amount (₹) | Date | Particulars | J.F. | Amount (₹) |
| :— | :— | :— | :— | :— | :— | :— | :— |
| | | | | | | | |
J.F. (Journal Folio): This column is used to write the page number of the Journal where the original entry is located.
Rules of Posting
The word “To” is used before the account name written on the debit side of a ledger account.
The word “By” is used before the account name written on the credit side of a ledger account.
All accounts from the Journal are opened in the Ledger.
If an account is debited in the Journal, the posting in the Ledger will be on the debit side of that account.
If an account is credited in the Journal, the posting in the Ledger will be on the credit side of that account.
Crucial Rule: The name of the account being posted is not written in the particulars. Instead, you write the name of the other account in the journal entry.
Example: For the entry Rent A/c Dr. To Cash A/c, when you post to the Rent A/c, you will write “To Cash A/c” on the debit side. When you post to the Cash A/c, you will write “By Rent A/c” on the credit side.
Part 5: Balancing an Account
At the end of an accounting period (e.g., a month or year), the businessman needs to know the final position of each account. Balancing is the process of totaling the debit and credit sides of an account to find the net difference.
How to Balance
Total both the debit side and the credit side separately.
Find the difference between the two totals.
Write this “difference” on the side that has the smaller total, so the two totals become equal.
Label this difference as “By Balance c/d” (carried down) if you wrote it on the credit side, or “To Balance c/d” if you wrote it on the debit side.
Finally, carry this balance down to the opposite side of the account below the total, labeling it “To Balance b/d” (brought down) to start the next period.
Balancing Different Types of Accounts
Asset Accounts (Real Accounts): These are balanced and will almost always have a Debit Balance (e.g., Cash, Plant, Furniture).
Liability Accounts (Personal Accounts): These are balanced and will almost always have a Credit Balance (e.g., Creditors, Loans).
Capital Account (Personal Account): This is balanced and will have a Credit Balance.
Expense & Revenue Accounts (Nominal Accounts): These accounts are not balanced. They are simply totaled at the end of the year. The totals are then transferred to the Trading and Profit & Loss Account to find the net profit or loss.
Part 6: Comprehensive Example (Journal -> Ledger -> Balancing)
Let’s record the following transactions in a Journal and then post them into a Ledger.
Transactions:
Jan 1: Commenced business with cash ₹50,000
Jan 3: Paid into bank ₹25,000
Jan 5: Purchased furniture for cash ₹5,000
Jan 8: Purchased goods and paid by cheque ₹15,000
Jan 8: Paid for carriage ₹500
Jan 14: Purchased Goods from K. Murthy ₹35,000
Jan 18: Cash Sales ₹32,000
Jan 20: Sold Goods to Ashok on credit ₹28,000
Jan 25: Paid cash to K. Murthy in full settlement ₹34,200 (Discount = ₹800)
Jan 28: Cash received from Ashok ₹20,000
Jan 31: Paid Rent for the month ₹2,000
Jan 31: Withdrew from bank for private use ₹2,500
Journal
Date
Particulars
L.F.
Amount (Dr.) (₹)
Amount (Cr.) (₹)
Jan 1
Cash A/c …Dr.
50,000
To Capital A/c
50,000
(Commenced business with cash)
Jan 3
Bank A/c …Dr.
25,000
To Cash A/c
25,000
(Cash paid in the Bank)
Jan 5
Furniture A/c …Dr.
5,000
To Cash A/c
5,000
(Purchased furniture for cash)
Jan 8
Purchase A/c …Dr.
15,000
To Bank A/c
15,000
(Purchased goods and paid by cheque)
Jan 8
Carriage A/c …Dr.
500
To Cash A/c
500
(Cash paid for carriage charges)
Jan 14
Purchase A/c …Dr.
35,000
To K. Murthy
35,000
(Goods purchased on credit)
Jan 18
Cash A/c …Dr.
32,000
To Sales A/c
32,000
(Goods sold for cash)
Jan 20
Ashok …Dr.
28,000
To Sales A/c
28,000
(Goods sold to Ashok credit)
Jan 25
K. Murthy …Dr.
35,000
To Cash A/c
34,200
To Discount A/c
800
(Cash paid to K. Murthy in full settlement)
Jan 28
Cash A/c …Dr.
20,000
To Ashok
20,000
(Cash received from Ashok on Account)
Jan 31
Rent A/c …Dr.
2,000
To Cash A/c
2,000
(Cash paid for rent)
Jan 31
Drawings A/c …Dr.
2,500
To Bank A/c
2,500
(Cash withdrawn from bank for domestic use)
Dr. Cash A/c Cr.
Date
Particulars
J.F.
Amount (₹)
Date
Particulars
J.F.
Amount (₹)
Jan 1
To Capital A/c
50,000
Jan 3
By Bank A/c
25,000
Jan 18
To Sales A/c
32,000
Jan 5
By Furniture A/c
5,000
Jan 28
To Ashok
20,000
Jan 8
By Carriage A/c
500
Jan 25
By K. Murthy
34,200
Jan 31
By Rent A/c
2,000
Jan 31
By Balance c/d
35,300
Total
1,02,000
1,02,000
Feb 1
To Balance b/d
35,300
Dr. Capital A/c Cr.
Date
Particulars
J.F.
Amount (₹)
Date
Particulars
J.F.
Amount (₹)
Jan 31
To Balance c/d
50,000
Jan 1
By Cash A/c
50,000
Total
50,000
50,000
Feb 1
By Balance b/d
50,000
Dr. Bank A/c Cr.
Date
Particulars
J.F.
Amount (₹)
Date
Particulars
J.F.
Amount (₹)
Jan 3
To Cash A/c
25,000
Jan 8
By Purchase A/c
15,000
Jan 31
By Drawings A/c
2,500
Jan 31
By Balance c/d
7,500
Total
25,000
25,000
Feb 1
To Balance b/d
7,500
Dr. Furniture A/c Cr.
Date
Particulars
J.F.
Amount (₹)
Date
Particulars
J.F.
Amount (₹)
Jan 5
To Cash A/c
5,000
Jan 31
By Balance c/d
5,000
Total
5,000
5,000
Feb 1
To Balance b/d
5,000
Dr. Purchase A/c Cr.
Date
Particulars
J.F.
Amount (₹)
Date
Particulars
J.F.
Amount (₹)
Jan 8
To Bank A/c
15,000
Jan 31
By Trading A/c
50,000
Jan 14
To K. Murthy
35,000
(Total transferred)
Total
50,000
50,000
Dr. Carriage A/c Cr.
Date
Particulars
J.F.
Amount (₹)
Date
Particulars
J.F.
Amount (₹)
Jan 8
To Cash A/c
500
Jan 31
By Trading A/c
500
Total
500
(Total transferred)
500
Dr. K. Murthy’s A/c Cr.
Date
Particulars
J.F.
Amount (₹)
Date
Particulars
J.F.
Amount (₹)
Jan 25
To Cash A/c
34,200
Jan 14
By Purchase A/c
35,000
Jan 25
To Discount A/c
800
Total
35,000
35,000
Dr. Sales A/c Cr.
Date
Particulars
J.F.
Amount (₹)
Date
Particulars
J.F.
Amount (₹)
Jan 31
To Trading A/c
60,000
Jan 18
By Cash A/c
32,000
(Total transferred)
Jan 20
By Ashok
28,000
Total
60,000
60,000
Dr. Ashok’s A/c Cr.
Date
Particulars
J.F.
Amount (₹)
Date
Particulars
J.F.
Amount (₹)
Jan 20
To Sales A/c
28,000
Jan 28
By Cash A/c
20,000
Jan 31
By Balance c/d
8,000
Total
28,000
28,000
Feb 1
To Balance b/d
8,000
Dr. Rent A/c Cr.
Date
Particulars
J.F.
Amount (₹)
Date
Particulars
J.F.
Amount (₹)
Jan 31
To Cash A/c
2,000
Jan 31
By P&L A/c
2,000
Total
2,000
(Total transferred)
2,000
Dr. Drawings A/c Cr.
Date
Particulars
J.F.
Amount (₹)
Date
Particulars
J.F.
Amount (₹)
Jan 31
To Bank A/c
2,500
Jan 31
By Balance c/d
2,500
Total
2,500
2,500
Feb 1
To Balance b/d
2,500
(Note: The Discount A/c would also be opened and its total transferred to the P&L A/c.)
📚 Keep Studying!
We hope these Financial Management and Accounting notes help you build a strong foundation for your BBA. LuNotes is your one-stop solution for all Lucknow University notes. Don’t forget to check out our notes for other subjects in your semester!
Found a mistake? We work hard to ensure all notes are 100% accurate and as per the latest LU syllabus. If you spot an error or have a suggestion, please [click here to report it]. (You would link this text to a contact form or email).
By LuNotes – your trusted for Lucknow University Semester exam notes, crafted with love. ❤️